
FDG PET-CT combines two powerful imaging technologies to create detailed pictures of what’s happening inside your body at the cellular level. This advanced scan detects cancer, infection, and inflammation by tracking how your cells use glucose, making it one of the most valuable diagnostic tools in modern medicine.
This guide is for patients scheduled for an FDG PET-CT scan, family members seeking to understand the process, and anyone curious about how this technology works. We’ll walk you through how FDG PET-CT technology works and explain its impressive cancer-detection capabilities. You’ll also learn how doctors use this scan to identify hidden infections and monitor inflammatory conditions throughout your body.
Understanding FDG PET-CT Technology and How It Works
What FDG tracer reveals about cellular activity in your body
FDG (fluorodeoxyglucose) acts as a radioactive sugar that mimics glucose, revealing how actively your cells consume energy. Cancer cells, infections, and inflamed tissues typically show increased glucose uptake, making them appear brighter on scan images. This metabolic signature helps doctors spot abnormalities that might not be visible on traditional imaging tests.
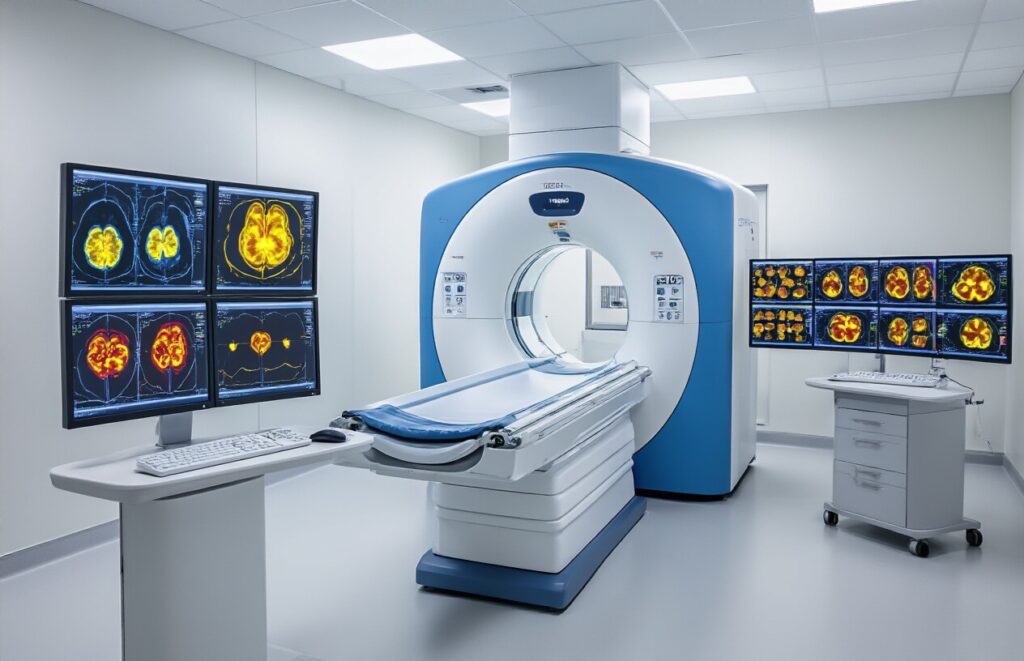
How PET and CT scans combine for superior diagnostic accuracy
The PET scan captures metabolic activity while the CT scan provides detailed anatomical structure, creating a comprehensive picture when combined. This fusion technology pinpoints exactly where abnormal activity occurs within your body, dramatically improving diagnostic precision compared to either scan alone.
Why glucose metabolism helps identify abnormal tissue
Abnormal cells often have altered energy requirements, consuming glucose at rates different from those of healthy tissue. Rapidly dividing cancer cells typically show intense glucose uptake, while infections create inflammatory responses that also increase metabolic activity. These patterns help distinguish between normal and problematic tissue areas.
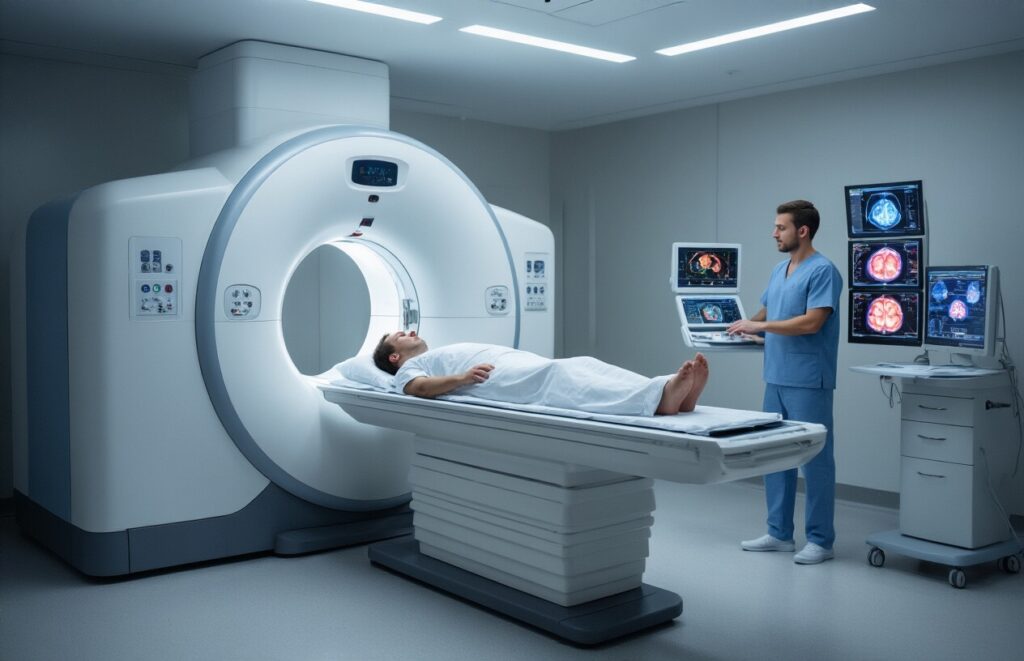
The step-by-step process of your FDG PET-CT scan
You’ll receive an FDG injection and wait 60-90 minutes for optimal tracer distribution throughout your body. The actual scanning takes 20-30 minutes as you lie still on a table that moves through the combined PET-CT machine. Multiple images are captured and processed to create detailed metabolic maps of your internal organs and tissues.
Cancer Detection Capabilities and Accuracy Rates
How FDG PET-CT spots cancer cells before symptoms appear
FDG PET-CT detects cancer by identifying cells with abnormally high glucose metabolism. Cancer cells consume glucose at rates 10-100 times higher than normal tissue, making them light up brightly on scans. This metabolic signature often appears months or even years before tumors grow large enough to cause physical symptoms or show up clearly on CT or MRI scans.
Which cancer types respond best to FDG imaging
| High FDG Uptake | Moderate FDG Uptake | Low FDG Uptake |
| Lung cancer | Breast cancer | Prostate cancer |
| Lymphoma | Colorectal cancer | Kidney cancer |
| Melanoma | Head/neck cancers | Well-differentiated thyroid |
| Esophageal cancer | Ovarian cancer | Slow-growing brain tumors |
Staging accuracy compared to traditional imaging methods
FDG PET-CT achieves 85-95% accuracy in cancer staging, significantly outperforming CT alone (60-75%) or MRI (70-80%). The combination reveals both anatomical structure and metabolic activity, catching small metastases that other scans miss. Studies show PET-CT changes treatment plans in 30-40% of cases by revealing previously unknown disease spread.
Monitoring treatment response and detecting recurrence
PET-CT tracks how well cancer responds to therapy by measuring changes in glucose uptake. Successful treatment typically results in a 50-80% reduction in FDG activity within weeks. For recurrence detection, PET-CT identifies returning cancer with 90% sensitivity, often 6-12 months before conventional imaging. This early detection allows doctors to adjust treatment strategies quickly, improving patient outcomes and survival rates.
Identifying Infections Through Metabolic Imaging
How does infected tissue show increased glucose uptake
Infected tissues act like metabolic hot spots on FDG PET-CT scans because immune cells rush to fight invading pathogens. White blood cells, particularly neutrophils and macrophages, consume massive amounts of glucose as they work overtime to eliminate bacteria, fungi, or other microorganisms. This creates bright areas of radiotracer accumulation that stand out clearly against the background of normal tissue.
Distinguishing between bacterial and viral infections
| Infection Type | FDG Uptake Pattern | Typical SUV Values | Location Characteristics |
| Bacterial | Intense, focal uptake | High (>4.0) | Well-defined borders, often with abscess formation |
| Viral | Mild, diffuse uptake | Moderate (2.0-4.0) | Scattered pattern, less defined boundaries |
Bacterial infections typically show more aggressive glucose consumption due to the intense inflammatory response they trigger. Imaging can reveal specific patterns that help doctors choose the right antibiotic treatment.
Locating hidden infection sources in complex cases
FDG PET-CT excels at detecting infections in unexpected locations, especially when patients have a fever of unknown origin or a complicated medical history. Whole-body scanning can reveal infected heart valves, spinal infections, or deep abscesses that conventional imaging might miss. This proves especially valuable for immunocompromised patients, where infections can spread silently throughout the body.
Inflammation Detection and Monitoring Benefits
Visualizing inflammatory processes throughout the body
FDG PET-CT excels at detecting inflammation because inflammatory cells consume glucose at much higher rates than normal tissue. The scan creates detailed maps showing exactly where inflammation occurs throughout your body, making it incredibly valuable for diagnosing conditions that might otherwise require multiple tests or invasive procedures.
Tracking autoimmune disease progression and treatment response
Doctors use FDG PET-CT to monitor autoimmune diseases like rheumatoid arthritis, inflammatory bowel disease, and vasculitis. The scans show how well treatments are working by measuring changes in metabolic activity over time. This helps your medical team adjust medications and treatment plans based on real-time data about your body’s inflammatory response.
Differentiating between active inflammation and scar tissue
One of the biggest challenges in medicine is distinguishing between active inflammation that needs treatment and old scar tissue that’s harmless. FDG PET-CT solves this problem because active inflammation shows up as bright spots on the scan, while scar tissue appears much dimmer or doesn’t show up at all.
Applications in cardiovascular and neurological inflammation
FDG PET-CT plays a crucial role in detecting inflammation in blood vessels, helping diagnose conditions like giant cell arteritis and atherosclerosis. In the brain, these scans can identify neuroinflammation associated with conditions such as multiple sclerosis, Alzheimer’s disease, and various types of encephalitis that might not be clearly visible on standard brain imaging.
Preparing for Your FDG PET-CT Scan

Essential dietary restrictions and fasting requirements
You’ll need to fast for at least 12 hours before your FDG PET-CT scan, consuming only plain water during this period. Avoid all foods and beverages containing sugar or caffeine, as well as chewing gum and mints. Your body needs to be fasting so the radioactive glucose tracer can accurately highlight areas of abnormal cellular activity. Skip your morning coffee and breakfast on scan day.
Medication adjustments needed before your appointment
Most medications can be continued as prescribed, but diabetic patients require special attention. If you take insulin or diabetes medications, your doctor will provide specific instructions about timing and dosage adjustments. Blood glucose levels must be below 200 mg/dL for accurate imaging results. Contact your healthcare team about any concerns regarding your regular medications before the appointment date.
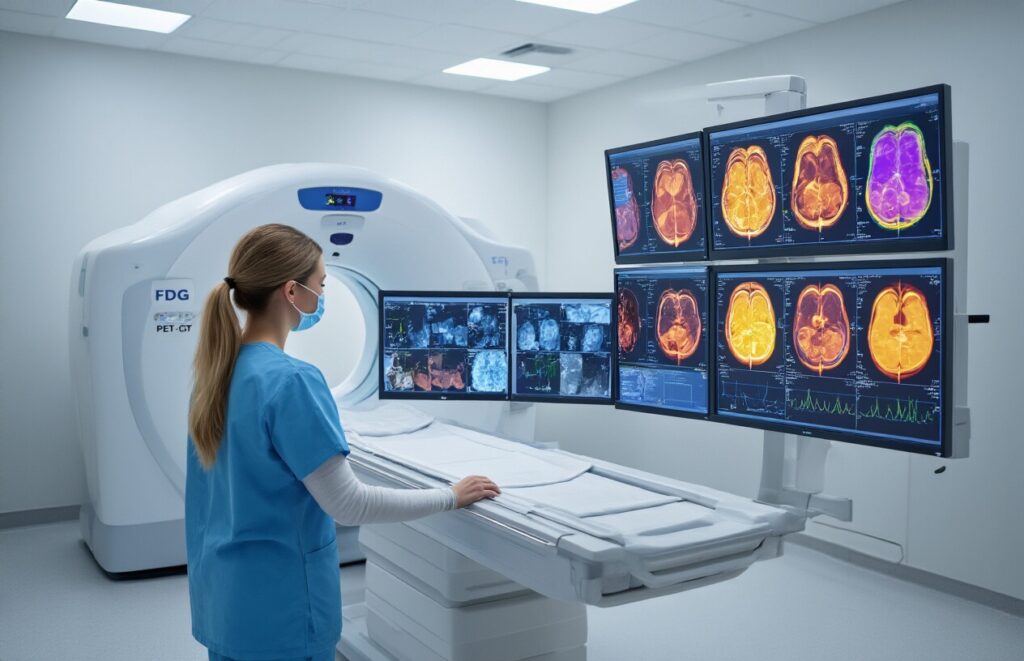
What to expect during the imaging procedure
The entire process takes 2-3 hours, though actual scanning time is only 30-45 minutes. First, you’ll receive an intravenous injection of the FDG radiotracer, then rest quietly for 60 minutes while it circulates through your body. The scanner resembles a large, donut-shaped machine in which you’ll lie still on a padded table that slides through the opening. The procedure is painless and silent.
Post-scan care and when to resume normal activities
You can resume normal eating and drinking immediately after your scan. The small amount of radiotracer clears from your body naturally within 24 hours through urine. Drink plenty of water to help flush the tracer from your system more quickly. Pregnant women and small children should avoid close contact with you for the remainder of the day as a precautionary measure.
Interpreting Your Results and Next Steps

Understanding SUV values and what they mean for your health
SUV (Standardized Uptake Value) measures how much radioactive glucose your tissues absorb during the scan. Normal tissue typically shows SUV values between 1 and 3, while suspicious areas often register four or higher. Higher numbers don’t automatically mean cancer – your age, blood sugar levels, and recent physical activity can affect these readings.
How radiologists distinguish between cancer, infection, and inflammation
Radiologists consider several factors beyond SUV values to make accurate diagnoses. Cancer cells usually show intense, focal uptake in specific locations, while infections often appear as ring-shaped patterns with central areas of reduced activity. Inflammation typically creates more diffuse, less intense uptake patterns that spread across larger tissue areas.
When additional testing or follow-up scans are necessary
Your doctor may recommend follow-up scans if initial results show borderline SUV values between 3-4, or if clinical symptoms don’t match imaging findings. Additional biopsies become necessary when PET-CT shows suspicious areas that weren’t previously known. Most patients receive repeat scans 3-6 months later to monitor treatment response or track changes in suspicious regions over time.

FDG PET-CT scans offer doctors a powerful way to see what’s happening inside your body at the cellular level. This technology combines two imaging methods to spot cancer cells, track infections, and monitor inflammation by watching how your body uses sugar. The scan can catch problems early, help doctors plan treatments, and track how well therapies are working. Getting ready for the scan is pretty straightforward – you’ll need to fast beforehand and avoid strenuous exercise, but the actual procedure is painless and takes about an hour.
If your doctor has recommended an FDG PET-CT scan, don’t worry about the process. Ask questions about your results and what they mean for your specific situation. This scan gives your medical team detailed information that helps them make the best decisions about your care. Work closely with your physician to understand your results and follow their recommendations for any next steps in your treatment or monitoring plan.